
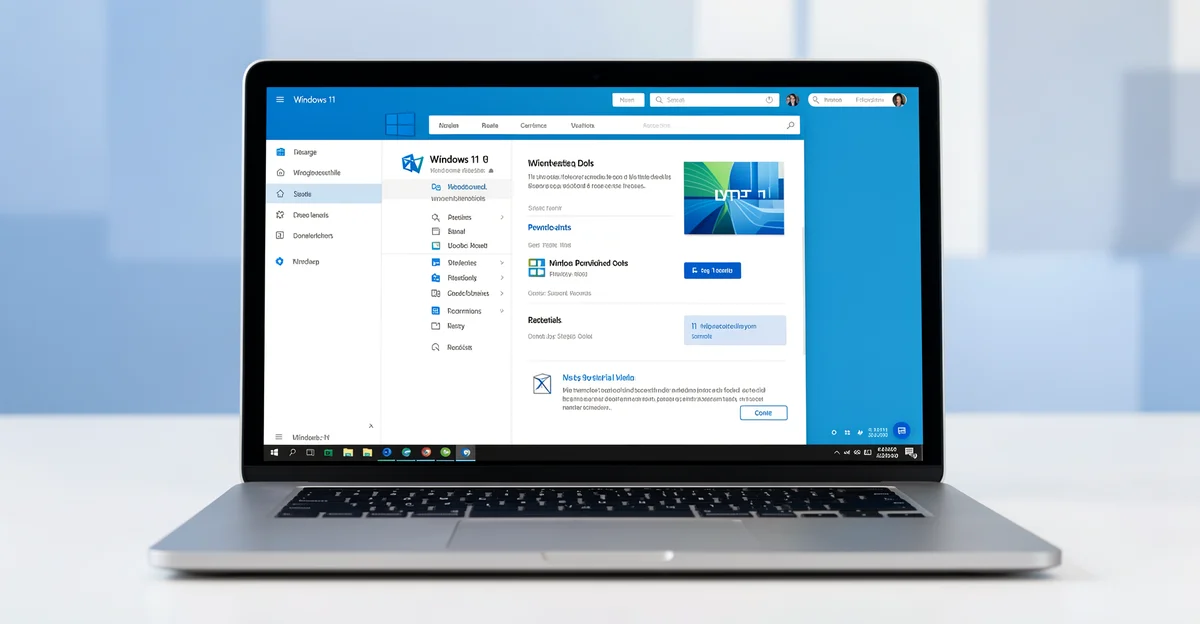
Every Windows PC slows down over time, whether it is a home laptop or a fleet of office workstations. The right Windows tools for better PC performance can help you clean up clutter, free system resources, and keep every machine running smoothly.
In this guide, we have rounded up 15 essential tools that suit both beginners and IT administrators. From built-in utilities to trusted third-party apps, each one tackles a specific performance issue. Let’s dive in and get your Windows systems running at their best.
Introduction
Every Windows PC slows down over time. Startup programs accumulate, temporary files pile up, background services multiply, and before long a machine that once booted in ten seconds takes two minutes to become usable. The good news is that Windows ships with dozens of built-in utilities designed to diagnose, clean, and accelerate your system — and there are also free, reputable third-party tools that fill the gaps. This guide covers 15 Essential Windows Tools for Better PC Performance in practical, step-by-step detail, whether you are a home user who wants a snappier laptop or an IT administrator managing a fleet of workstations.
Performance tuning is not about installing the most utilities or running the most aggressive registry cleaners. It is about understanding where your system spends its resources — CPU, memory, disk, network — and using the right tool to address each bottleneck. The 15 tools we will examine range from Task Manager and Resource Monitor to Storage Sense, Disk Cleanup, Autoruns, and Windows Performance Monitor. Each has a specific purpose, and together they form a complete toolkit for diagnosing and resolving the most common causes of sluggish Windows performance.
Key Concepts
Before diving into the tools themselves, it helps to understand a few core concepts that apply regardless of which utility you are using.
Resource bottlenecks. A PC slows down when one of four resources reaches saturation: CPU, RAM, disk I/O, or network bandwidth. Identifying which resource is constrained is the first step in any performance investigation. A machine with 8 GB of RAM that routinely uses 7.5 GB is memory-bound; adding more RAM will help far more than a registry cleaner.
Startup impact. Every program that launches at boot consumes CPU, memory, and disk time. Windows Task Manager’s Startup tab assigns each entry a Low, Medium, or High impact rating. Disabling High-impact entries is often the single fastest way to improve boot time.
Background services and scheduled tasks. Windows runs hundreds of services and scheduled tasks. Many are essential; others are third-party updaters that check for updates every few minutes. Tools such as Services.msc and Task Scheduler let you audit and control these.
Architecture compatibility. Always verify software compatibility with your hardware architecture (ARM64 vs x86). A 64-bit x86 utility will not run natively on an ARM64 device such as a Surface Pro X or Windows Dev Kit. Most tools now offer separate ARM64 builds, but older monitoring utilities may not. Running x86 software under emulation works for many applications but adds overhead and can distort performance measurements.
Update sequencing. Keeping your operating system updated before installation prevents dependency conflicts. Install the latest cumulative updates and .NET runtime versions before adding third-party performance tools, because many of them rely on current Visual C++ redistributables and management frameworks.
Deep Dive
The 15 tools below are grouped by function: monitoring, cleanup, startup and service management, and optimization. You do not need all of them on every machine, but an IT administrator should be familiar with each.
Monitoring and diagnostics
- Task Manager (Ctrl+Shift+Esc): The first stop for any slowdown. The Processes tab shows live CPU, memory, disk, and network usage per process. The Performance tab graphs overall resource utilization.
- Resource Monitor (resmon.exe): A deeper view than Task Manager, with per-process disk and network activity, plus the ability to filter by file handle or network connection.
- Performance Monitor (perfmon.msc): The professional-grade tool for creating data collector sets, logging counters over time, and generating baseline reports for multiple machines.
- Reliability Monitor: Found in Control Panel under Security and Maintenance, it charts application crashes, Windows updates, and driver failures over time — invaluable for spotting patterns.
- Event Viewer (eventvwr.msc): The Windows System and Application logs record warnings and errors that often explain intermittent freezes and failed updates.
Cleanup and storage
- Disk Cleanup (cleanmgr.exe): Removes temporary files, Windows Update leftovers, and system cache. The “Clean up system files” option reclaims several gigabytes on most machines.
- Storage Sense: Configurable in Settings under System > Storage, it automatically deletes temporary files and empties the Recycle Bin on a schedule.
- Defragment and Optimize Drives (dfrgui.exe): Retrims SSDs and defragments hard drives. Windows schedules this weekly by default, but manual runs help after large file operations.
- Disk Management (diskmgmt.msc): Useful for extending partitions and checking drive health, especially before a cleanup that requires free space.
Startup, services, and scheduled tasks
- Task Manager Startup tab: Disable unnecessary launch entries and measure the effect on boot time.
- System Configuration (msconfig.exe): Offers a diagnostic startup mode for isolating whether a third-party service is causing instability.
- Services (services.msc): Set non-essential third-party services to Manual instead of Automatic. Never disable Microsoft services without research.
- Task Scheduler (taskschd.msc): Audit scheduled tasks from third-party updaters and disable those you do not need.
- Autoruns (Sysinternals): The most comprehensive startup auditor available, covering logon entries, scheduled tasks, drivers, and codecs that Task Manager does not show.
Optimization and maintenance
- Windows Update: Drivers, security patches, and runtime updates are delivered here. Always run it before installing new performance software.
- Windows Memory Diagnostic (mdsched.exe): Tests RAM for faults that cause random freezes and blue screens.
Two of these tools deserve special mention for administrators. Autoruns, part of the Sysinternals suite, can export a baseline of startup entries from a healthy machine and compare it against a problematic one — a fast way to detect unwanted software. Windows Performance Monitor can save counter logs that you review later, which is essential when users report slowdowns that you cannot reproduce on demand.
Also note the architecture caveat again: download the ARM64 build of any Sysinternals or third-party tool when deploying to ARM devices. And run Windows Update first, because missing .NET or Visual C++ dependencies will cause some of these utilities to fail silently at launch.
Best Practices
Follow these guidelines to get reliable results without introducing new problems.
- Change one thing at a time. Apply a single optimization, measure the effect, then proceed. Batch changes make it impossible to attribute improvements or regressions.
- Establish a baseline. Before optimizing, record boot time, idle memory usage, and a few Performance Monitor counters. Without a baseline, you cannot prove improvement.
- Verify architecture before deployment. Always verify software compatibility with your hardware architecture (ARM64 vs x86). This is especially important in mixed fleets containing both Intel/AMD and Snapdragon-based laptops.
- Update the OS first. Keeping your operating system updated before installation prevents dependency conflicts. Run Windows Update, reboot, and confirm no updates are pending before installing tools.
- Avoid aggressive “cleaner” utilities. Registry cleaners and all-in-one optimizers rarely improve performance and can break applications. The built-in tools in this guide are safer and more effective.
- Document your changes. Administrators should record which services were set to Manual, which tasks were disabled, and on which machines. Group Policy or a configuration management tool can enforce these settings consistently.
- Test on a pilot group. Roll out service and startup changes to a small set of users before applying them organization-wide.
- Re-audit quarterly. New software reintroduces startup entries and scheduled tasks. A quarterly review keeps machines lean.
Step-by-Step: Applying the 15 Tools
The following sequence takes you from understanding to measurable results. It is written so that beginners and administrators can follow the same path, with administrators scaling the procedure across multiple machines.
Step 1: Understand the fundamentals
Learn the four resource types — CPU, memory, disk, and network — and how each affects responsiveness. Open Task Manager and watch the Performance tab for a few minutes under normal use. Notice which resource peaks when you open a browser or start an application. This basic literacy makes every subsequent tool easier to interpret.

Step 2: Assess your starting point
Record baseline measurements: boot time, idle CPU percentage, idle memory usage, and free disk space. Open Resource Monitor and note the top five processes by disk activity. If you manage multiple PCs, gather these figures from a representative sample. On ARM64 devices, confirm which tools have native builds before you begin.
Step 3: Set clear goals
Define concrete targets, such as “reduce boot time to under 30 seconds” or “keep idle memory below 40 percent.” Goals keep you from over-optimizing. Administrators should define organization-wide thresholds and identify which machines fall outside them.

Step 4: Gather necessary resources
Run Windows Update and reboot until no updates remain. This prevents dependency conflicts when installing utilities. Download the correct architecture version of Autoruns and any other third-party tool. For fleets, prepare a deployment method such as Group Policy, Intune, or a scripting tool like PowerShell.
Step 5: Apply the core methods
Work through the toolset in order:
- Use Disk Cleanup and Storage Sense to reclaim disk space.
- Open the Task Manager Startup tab and disable High-impact entries.
- Use Autoruns to audit logon entries and scheduled tasks, removing anything unrecognized.
- Set non-essential third-party services to Manual in services.msc.
- Run Disk Defragment and Optimize Drives on SSDs and HDDs.
- Use Windows Memory Diagnostic if you suspect hardware faults.
- Review Event Viewer and Reliability Monitor for recurring errors.
Make one change at a time and retest after each. Administrators can script the service and scheduled-task changes with PowerShell to apply them uniformly across machines.
Step 6: Monitor your progress
Re-measure the same baselines you recorded in Step 2. Compare boot time, idle memory, and disk activity. Use Performance Monitor to create a data collector set that logs counters daily, so you can detect regressions over time. Schedule a quarterly re-audit with Autoruns, since new software will reintroduce startup entries.
FAQ
How long does it take to complete 15 Essential Windows Tools for Better PC Performance?
A single PC typically takes 1 to 2 hours for the full procedure, including baseline measurement, cleanup, and re-testing. The running of individual tools is quick — Disk Cleanup may take several minutes and Memory Diagnostic requires a reboot — but the deliberate one-change-at-a-time approach is what consumes most of the time. For IT administrators deploying across a fleet, expect a pilot phase of a few days followed by a staged rollout that may take one to two weeks depending.
You now have a complete workflow for 15 Essential Windows Tools for Better PC Performance. Keep your system updated, monitor resource usage, and revisit this guide when software versions change.
Next steps: harden your server firewall, set up automated backups, and explore related tutorials linked above.